Qt for Python Tutorial: Data Visualization Tool: Difference between revisions
No edit summary |
|||
| Line 20: | Line 20: | ||
=== First step: Command line options and reading the data === | === First step: Command line options and reading the data === | ||
There are many ways of reading data from Python, and this will not recommend the optimal way of doing it, but just state one of the alternatives out there. | |||
For this example you can also try: | |||
* Native file reading, | |||
* The [https://docs.python.org/3/library/csv.html csv] module | |||
* The [https://www.numpy.org/ numpy] module | |||
* among others. | |||
We will use [https://pandas.pydata.org/ pandas], because it provides a simple way of reading and filtering data. | |||
Additionally, we can pass the data file we want to use via command line, and for this one can use the built-in sys module to access the argument of the script but luckily there are better ways to achieve this, like the argparse module. | |||
Using argparse allow us to have a simple interaction command line interface for our project, so let's take a look how a first attempt | |||
will look like: | |||
<syntaxhighlight style="font-size: 12px;" lang="python" line='line'> | <syntaxhighlight style="font-size: 12px;" lang="python" line='line'> | ||
import argparse | import argparse | ||
Revision as of 14:22, 14 December 2018
This tutorial was part of the second Qt for Python webinar.
Motivation

There are many sources of open data that one can use for interesting project, from statistics on social networks, to information from sensors all over the world.
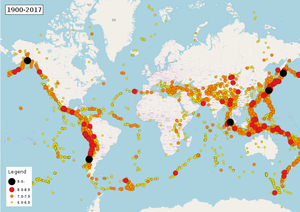
One of the examples for this is the U.S. Geological Survey which provides updated information regarding the earthquakes we have in the last hours, day, week, and month (You can visit the website and download the CSV files with this information.
Even though they provide filtered information related to the magnitude of the earthquakes, we will try to use the raw data (all_day.csv, all_hour.csv, ... ) to deal with missing information, or even incorrect data, so we can filter the data first just for the example.
Some useful resources to understand the details of this tutorial are:
- Qt Model View Programming
- QMainWindow details diagram
- QAbstractTableModel subclassing requirements
- QtCharts examples
- Python Pandas tutorial
- Python argparse tutorial
First step: Command line options and reading the data
There are many ways of reading data from Python, and this will not recommend the optimal way of doing it, but just state one of the alternatives out there.
For this example you can also try:
We will use pandas, because it provides a simple way of reading and filtering data.
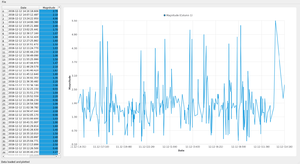
Additionally, we can pass the data file we want to use via command line, and for this one can use the built-in sys module to access the argument of the script but luckily there are better ways to achieve this, like the argparse module. Using argparse allow us to have a simple interaction command line interface for our project, so let's take a look how a first attempt will look like:
import argparse
import pandas as pd

def read_data(fname):
    return pd.read_csv(fname)

if __name__ == "__main__":
    options = argparse.ArgumentParser()
    options.add_argument("-f", "--file", type=str, required=True)
    args = options.parse_args()
    data = read_data(args.file)
    print(data)
Second step: Filtering data and Timezones
import argparse
import pandas as pd

from PySide2.QtCore import QDateTime, QTimeZone

def transform_date(utc, timezone=None):
    utc_fmt = "yyyy-MM-ddTHH:mm:ss.zzzZ"
    new_date = QDateTime().fromString(utc, utc_fmt)
    if timezone:
        new_date.setTimeZone(timezone)
    return new_date


def read_data(fname):
    # Read the CSV content
    df = pd.read_csv(fname)

    # Remove wrong magnitudes
    df = df.drop(df[df.mag < 0].index)
    magnitudes = df["mag"]

    # My local timezone
    timezone = QTimeZone(b"Europe/Berlin")

    # Get timestamp transformed to our timezone
    times = df["time"].apply(lambda x: transform_date(x, timezone))

    return times, magnitudes


if __name__ == "__main__":
    options = argparse.ArgumentParser()
    options.add_argument("-f", "--file", type=str, required=True)
    args = options.parse_args()
    data = read_data(args.file)
    print(data)
Third step: Creating an empty QMainWindow
import sys
import argparse
import pandas as pd

from PySide2.QtCore import (QAbstractTableModel, QDateTime, QModelIndex,
                            QRect, Qt, QTimeZone, Slot)
from PySide2.QtGui import QColor, QPainter
from PySide2.QtWidgets import (QAction, QApplication, QHBoxLayout, QHeaderView,
                               QMainWindow, QSizePolicy, QTableView, QWidget)
from PySide2.QtCharts import QtCharts


def transform_date(utc, timezone=None):
    # ...

def read_data(fname):
    # ...


class MainWindow(QMainWindow):
    def __init__(self):
        QMainWindow.__init__(self)
        self.setWindowTitle("Eartquakes information")

        # Menu
        self.menu = self.menuBar()
        self.file_menu = self.menu.addMenu("File")

        ## Exit QAction
        exit_action = QAction("Exit", self)
        exit_action.setShortcut("Ctrl+Q")
        exit_action.triggered.connect(self.exit_app)

        self.file_menu.addAction(exit_action)

        # Status Bar
        self.status = self.statusBar()
        self.status.showMessage("Data loaded and plotted")

        # Window dimensions
        geometry = app.desktop().availableGeometry(self)
        self.setFixedSize(geometry.width() * 0.8, geometry.height() * 0.7)

    @Slot()
    def exit_app(self, checked):
        sys.exit()


if __name__ == "__main__":
    options = argparse.ArgumentParser()
    options.add_argument("-f", "--file", type=str, required=True)
    args = options.parse_args()
    data = read_data(args.file)

    # Qt Application
    app = QApplication(sys.argv)

    window = MainWindow()
    window.show()

    sys.exit(app.exec_())
Fourth step: Adding a QTableView to display the data
import sys
import argparse
import pandas as pd

from PySide2.QtCore import (QAbstractTableModel, QDateTime, QModelIndex,
                            Qt, QTimeZone, Slot)
from PySide2.QtGui import QColor
from PySide2.QtWidgets import (QAction, QApplication, QHBoxLayout, QHeaderView,
                               QMainWindow, QSizePolicy, QTableView, QWidget)


class CustomTableModel(QAbstractTableModel):
    def __init__(self, data=None):
        QAbstractTableModel.__init__(self)
        self.load_data(data)

    def load_data(self, data):
        self.input_dates = data[0].values
        self.input_magnitudes = data[1].values

        self.column_count = 2
        self.row_count = len(self.input_magnitudes)

    def rowCount(self, parent=QModelIndex()):
        return self.row_count

    def columnCount(self, parent=QModelIndex()):
        return self.column_count

    def headerData(self, section, orientation, role):
        if role != Qt.DisplayRole:
            return None
        if orientation == Qt.Horizontal:
            return ("Date", "Magnitude")[section]
        else:
            return "{}".format(section)

    def data(self, index, role = Qt.DisplayRole):
        column = index.column()
        row = index.row()

        if role == Qt.DisplayRole:
            if column == 0:
                raw_date = self.input_dates[row]
                date = "{}".format(raw_date.toPython())
                return date[:-3]
            elif column == 1:
                return "{:.2f}".format(self.input_magnitudes[row])
        elif role == Qt.BackgroundRole:
            return QColor(Qt.white)
        elif role == Qt.TextAlignmentRole:
            return Qt.AlignRight

        return None

class Widget(QWidget):
    def __init__(self, data):
        QWidget.__init__(self)

        # Getting the Model
        self.model = CustomTableModel(data)

        # Creating a QTableView
        self.table_view = QTableView()
        self.table_view.setModel(self.model)

        # QTableView Headers
        self.horizontal_header = self.table_view.horizontalHeader()
        self.vertical_header = self.table_view.verticalHeader()
        self.horizontal_header.setSectionResizeMode(QHeaderView.ResizeToContents)
        self.vertical_header.setSectionResizeMode(QHeaderView.ResizeToContents)
        self.horizontal_header.setStretchLastSection(True)

        # QWidget Layout
        self.main_layout = QHBoxLayout()
        size = QSizePolicy(QSizePolicy.Preferred, QSizePolicy.Preferred)

        ## Left layout
        size.setHorizontalStretch(1)
        self.table_view.setSizePolicy(size)
        self.main_layout.addWidget(self.table_view)

        # Set the layout to the QWidget
        self.setLayout(self.main_layout)

def transform_date(utc, timezone=None):
    # ...


def read_data(fname):
    # ...


class MainWindow(QMainWindow):
    def __init__(self, widget):
        # ...
        self.setCentralWidget(widget)

    @Slot()
    def exit_app(self, checked):
        sys.exit()


if __name__ == "__main__":
    options = argparse.ArgumentParser()
    options.add_argument("-f", "--file", type=str, required=True)
    args = options.parse_args()
    data = read_data(args.file)

    # Qt Application
    app = QApplication(sys.argv)

    # QWidget
    widget = Widget(data)
    # QMainWindow using QWidget as central widget
    window = MainWindow(widget)

    window.show()
    sys.exit(app.exec_())
Fifth step: Adding a QChartView
import sys
import argparse
import pandas as pd

from PySide2.QtCore import (QAbstractTableModel, QDateTime, QModelIndex,
                            QRect, Qt, QTimeZone, Slot)
from PySide2.QtGui import QColor, QPainter
from PySide2.QtWidgets import (QAction, QApplication, QHBoxLayout, QHeaderView,
                               QMainWindow, QSizePolicy, QTableView, QWidget)
from PySide2.QtCharts import QtCharts


class CustomTableModel(QAbstractTableModel):
    def __init__(self, data=None):
        QAbstractTableModel.__init__(self)
        self.color = "#3a85be"
        self.load_data(data)

    def load_data(self, data):
        self.input_dates = data[0].values
        self.input_magnitudes = data[1].values

        self.column_count = 2
        self.row_count = len(self.input_magnitudes)

    def rowCount(self, parent=QModelIndex()):
        return self.row_count

    def columnCount(self, parent=QModelIndex()):
        return self.column_count

    def headerData(self, section, orientation, role):
        if role != Qt.DisplayRole:
            return None
        if orientation == Qt.Horizontal:
            return ("Date", "Magnitude")[section]
        else:
            return "{}".format(section)

    def data(self, index, role = Qt.DisplayRole):
        column = index.column()
        row = index.row()

        if role == Qt.DisplayRole:
            if column == 0:
                raw_date = self.input_dates[row]
                date = "{}".format(raw_date.toPython())
                return date[:-3]
            elif column == 1:
                return "{:.2f}".format(self.input_magnitudes[row])
        elif role == Qt.BackgroundRole:
            return (QColor(Qt.white), QColor(self.color))[column]
        elif role == Qt.TextAlignmentRole:
            return Qt.AlignRight

        return None

class Widget(QWidget):
    def __init__(self, data):
        QWidget.__init__(self)

        # Getting the Model
        self.model = CustomTableModel(data)

        # Creating a QTableView
        self.table_view = QTableView()
        self.table_view.setModel(self.model)

        # QTableView Headers
        self.horizontal_header = self.table_view.horizontalHeader()
        self.vertical_header = self.table_view.verticalHeader()
        self.horizontal_header.setSectionResizeMode(QHeaderView.ResizeToContents)
        self.vertical_header.setSectionResizeMode(QHeaderView.ResizeToContents)
        self.horizontal_header.setStretchLastSection(True)

        # Creating QChart
        self.chart = QtCharts.QChart()
        self.chart.setAnimationOptions(QtCharts.QChart.AllAnimations)

        # Creating QChartView
        self.chart_view = QtCharts.QChartView(self.chart)
        self.chart_view.setRenderHint(QPainter.Antialiasing)

        # QWidget Layout
        self.main_layout = QHBoxLayout()
        size = QSizePolicy(QSizePolicy.Preferred, QSizePolicy.Preferred)

        ## Left layout
        size.setHorizontalStretch(1)
        self.table_view.setSizePolicy(size)
        self.main_layout.addWidget(self.table_view)

        ## Right Layout
        size.setHorizontalStretch(4)
        self.chart_view.setSizePolicy(size)
        self.main_layout.addWidget(self.chart_view)

        # Set the layout to the QWidget
        self.setLayout(self.main_layout)


def transform_date(utc, timezone=None):
    # ...


def read_data(fname):
    # ...


class MainWindow(QMainWindow):
    # ...


if __name__ == "__main__":
    options = argparse.ArgumentParser()
    options.add_argument("-f", "--file", type=str, required=True)
    args = options.parse_args()
    data = read_data(args.file)

    # Qt Application
    app = QApplication(sys.argv)

    # QWidget
    widget = Widget(data)
    # QMainWindow using QWidget as central widget
    window = MainWindow(widget)

    window.show()
    sys.exit(app.exec_())
Final Result
import sys
import argparse
import pandas as pd

from PySide2.QtCore import (QAbstractTableModel, QDateTime, QModelIndex,
                            Qt, QTimeZone, Slot)
from PySide2.QtGui import QColor, QPainter
from PySide2.QtWidgets import (QAction, QApplication, QHBoxLayout, QHeaderView,
                               QMainWindow, QSizePolicy, QTableView, QWidget)
from PySide2.QtCharts import QtCharts


class CustomTableModel(QAbstractTableModel):
    def __init__(self, data=None):
        QAbstractTableModel.__init__(self)
        self.color = None
        self.load_data(data)

    def load_data(self, data):
        self.input_dates = data[0].values
        self.input_magnitudes = data[1].values

        self.column_count = 2
        self.row_count = len(self.input_magnitudes)

    def rowCount(self, parent=QModelIndex()):
        return self.row_count

    def columnCount(self, parent=QModelIndex()):
        return self.column_count

    def headerData(self, section, orientation, role):
        if role != Qt.DisplayRole:
            return None
        if orientation == Qt.Horizontal:
            return ("Date", "Magnitude")[section]
        else:
            return "{}".format(section)

    def data(self, index, role=Qt.DisplayRole):
        column = index.column()
        row = index.row()

        if role == Qt.DisplayRole:
            if column == 0:
                raw_date = self.input_dates[row]
                date = "{}".format(raw_date.toPython())
                return date[:-3]
            elif column == 1:
                return "{:.2f}".format(self.input_magnitudes[row])
        elif role == Qt.BackgroundRole:
            return (QColor(Qt.white), QColor(self.color))[column]
        elif role == Qt.TextAlignmentRole:
            return Qt.AlignRight

        return None


class Widget(QWidget):
    def __init__(self, data):
        QWidget.__init__(self)

        # Getting the Model
        self.model = CustomTableModel(data)

        # Creating a QTableView
        self.table_view = QTableView()
        self.table_view.setModel(self.model)

        # QTableView Headers
        resize = QHeaderView.ResizeToContents
        self.horizontal_header = self.table_view.horizontalHeader()
        self.vertical_header = self.table_view.verticalHeader()
        self.horizontal_header.setSectionResizeMode(resize)
        self.vertical_header.setSectionResizeMode(resize)
        self.horizontal_header.setStretchLastSection(True)

        # Creating QChart
        self.chart = QtCharts.QChart()
        self.chart.setAnimationOptions(QtCharts.QChart.AllAnimations)
        self.add_series("Magnitude (Column 1)", [0, 1])

        # Creating QChartView
        self.chart_view = QtCharts.QChartView(self.chart)
        self.chart_view.setRenderHint(QPainter.Antialiasing)

        # QWidget Layout
        self.main_layout = QHBoxLayout()
        size = QSizePolicy(QSizePolicy.Preferred, QSizePolicy.Preferred)

        # Left layout
        size.setHorizontalStretch(1)
        self.table_view.setSizePolicy(size)
        self.main_layout.addWidget(self.table_view)

        # Right Layout
        size.setHorizontalStretch(4)
        self.chart_view.setSizePolicy(size)
        self.main_layout.addWidget(self.chart_view)

        # Set the layout to the QWidget
        self.setLayout(self.main_layout)

    def add_series(self, name, columns):
        # Create QLineSeries
        self.series = QtCharts.QLineSeries()
        self.series.setName(name)

        # Filling QLineSeries
        for i in range(self.model.rowCount()):
            # Getting the data
            t = self.model.index(i, 0).data()
            date_fmt = "yyyy-MM-dd HH:mm:ss.zzz"

            x = QDateTime().fromString(t, date_fmt).toMSecsSinceEpoch()
            y = float(self.model.index(i, 1).data())

            if x > 0 and y > 0:
                self.series.append(x, y)

        self.chart.addSeries(self.series)

        # Setting X-axis
        self.axis_x = QtCharts.QDateTimeAxis()
        self.axis_x.setTickCount(10)
        self.axis_x.setFormat("dd.MM (h:mm)")
        self.axis_x.setTitleText("Date")
        self.chart.addAxis(self.axis_x, Qt.AlignBottom)
        self.series.attachAxis(self.axis_x)
        # Setting Y-axis
        self.axis_y = QtCharts.QValueAxis()
        self.axis_y.setTickCount(10)
        self.axis_y.setLabelFormat("%.2f")
        self.axis_y.setTitleText("Magnitude")
        self.chart.addAxis(self.axis_y, Qt.AlignLeft)
        self.series.attachAxis(self.axis_y)

        # Getting the color from the QChart to use it on the QTableView
        self.model.color = "{}".format(self.series.pen().color().name())


def transform_date(utc, timezone=None):
    utc_fmt = "yyyy-MM-ddTHH:mm:ss.zzzZ"
    new_date = QDateTime().fromString(utc, utc_fmt)
    if timezone:
        new_date.setTimeZone(timezone)
    return new_date


def read_data(fname):
    # Read the CSV content
    df = pd.read_csv(fname)

    # Remove wrong magnitudes
    df = df.drop(df[df.mag < 0].index)
    magnitudes = df["mag"]

    # My local timezone
    timezone = QTimeZone(b"Europe/Berlin")

    # Get timestamp transformed to our timezone
    times = df["time"].apply(lambda x: transform_date(x, timezone))

    return times, magnitudes


class MainWindow(QMainWindow):
    def __init__(self, widget):
        QMainWindow.__init__(self)
        self.setWindowTitle("Eartquakes information")

        # Menu
        self.menu = self.menuBar()
        self.file_menu = self.menu.addMenu("File")

        # Exit QAction
        exit_action = QAction("Exit", self)
        exit_action.setShortcut("Ctrl+Q")
        exit_action.triggered.connect(self.exit_app)

        self.file_menu.addAction(exit_action)

        # Status Bar
        self.status = self.statusBar()
        self.status.showMessage("Data loaded and plotted")

        # Window dimensions
        geometry = app.desktop().availableGeometry(self)
        self.setFixedSize(geometry.width() * 0.8, geometry.height() * 0.7)
        self.setCentralWidget(widget)

    @Slot()
    def exit_app(self, checked):
        sys.exit()


if __name__ == "__main__":
    options = argparse.ArgumentParser()
    options.add_argument("-f", "--file", type=str, required=True)
    args = options.parse_args()
    data = read_data(args.file)

    # Qt Application
    app = QApplication(sys.argv)

    # QWidget
    widget = Widget(data)
    # QMainWindow using QWidget as central widget
    window = MainWindow(widget)

    window.show()
    sys.exit(app.exec_())
