Coin glossary for Grafana users: Difference between revisions
Created page with "test" |
No edit summary |
||
| (77 intermediate revisions by 2 users not shown) | |||
| Line 1: | Line 1: | ||
test | This article explains the glossary related to '''Coin''', the Qt Company Continuous Integration system, from a Grafana user’s perspective. It provides a basic understanding of Coin terminology that is helpful for correctly interpreting metrics, dashboards, and trends. The page presents a simplified view of Coin concepts as they appear in Grafana and intentionally omits internal implementation details. For deeper technical explanations, see the references listed in ''[[Further reading]]''. | ||
A '''task''' represents a single CI job scheduled either by a user or by agents. Every task has a specific type, such as: | |||
[[File:Coin task types jpg.jpg|thumb|Coin web interface displaying different task types: Integration, Status check and Early warning|600x600px]] | |||
* '''Integration''' - task that tries to integrate a change in Gerrit into a Qt submodule | |||
* '''Early warning -''' pre-check scheduled from Gerrit | |||
* '''Status check''' a job scheduled by a user directly on the Coin web interface | |||
* '''Nightly and Health checks -''' special tasks run every night to test the latest versions of all Qt submodules. Health checks build and test the latest qt5.git and all submodules on their last submodule-updated SHA-1s | |||
Task types are labeled in the Coin web interface, they have distinct icons, and the same categorization (for example, Integration vs. Status check) also appears in different tables across Grafana dashboards. | |||
[[File:Task type.png|thumb|600x600px|Drop down menu of Grafana dashboard allowing to choose task type for customized data view]] | |||
See related dashboard: | |||
[Https://testresults.qt.io/grafana/d/d55b6230-5ceb-4962-acc2-83810e2be68c/things-gone-wrong-in-last-healthcheck Recent Health Checks Analysis Dashboard] | |||
For most flaky test statistics, only test results from integrations tasks are typically considered. | |||
Each task has a unique '''task id''', which serves as its identifier. The id can be used to construct a URL that shows the status and results of a Coin task, following the pattern:[[File:Task url.jpg|Grafana table panel displaying task URLs|600x600px|alt=Grafana table panel displaying task URLs|thumb]]https://testresults.qt.io/coin/integration/qt/{module_name}/tasks/{task_id} | |||
for example: https://testresults.qt.io/coin/integration/qt/qt5/tasks/nightly1767303902 | |||
Here, qt5 is the module_name and nightly1767303902 is the task_id. | |||
Tasks URLs can be found in panels providing detailed information about test runs (see picture). | |||
[[File:Screenshot from 2026-01-02 17-10-09.png|thumb|Coin web interface displaying workitem types: Provisioning, Build and Test|600x600px]]'''Workitems''' | |||
Each task contains several workitems, organized into three categories: | |||
* '''Provision -''' create images building and testing | |||
* '''Build -''' build libraries and tests | |||
* '''Test -''' execute tests | |||
'''Workitem States''' | |||
Each workitem has a '''state''' that describes its current status or final outcome. Possible states include:[[File:Test workitem state.png|thumb|Coin web interface displaying qt/qtdeclarative workitem states: Done, Error and Cancelled|600x600px]] | |||
* '''Done''' – completed successfully | |||
* '''Running''' – currently in progress | |||
* '''Cancelled''' –job was cancelled or failed before the workitem has completed | |||
* '''Waiting for hardware''' - waiting for resources either as actual hardware or virtual machine | |||
* '''Failed''' – encountered some sort of execution error | |||
* '''Error''' – any failure outside of the VM running instructions | |||
* '''Timeout -''' given state (Running, or Waiting for hardware) did not finish within time limits | |||
* '''Insignificant''' – workitem failed, but the result does not affect the overall task result | |||
'''Build platforms''' | |||
[[File:Config id.png|thumb|Coin web interface displaying different config ids for qt/qtbase test workitem: rhel-9.6, sles-15_sp6-minimal-static, documentation-warnings and other|600x600px]]Qt is a multi-module, cross-platform library. Qt modules are often—but not always—built on a '''host platform''' and then executed and tested on a '''target platform.''' In most cases, a platform is defined by a combination of: operating system and version (e.g. macOS 12, Ubuntu 20.04), processor architecture (e.g. x86, x86_64, ARM64) and compiler (e.g. Clang, GCC, MSVC). In Grafana, this information is exposed through fields such as host_os_version, target_os_version, host_arch, target_arch, host_compiler, and target_compiler. Note that that some qt builds run on virtual or embedded platforms, and require emulator eg Android, VxWorks. | |||
Coin tracks platform details in even greater detail using so called '''configuration ids''' or '''configs'''. These identifiers describe in more detail concrete build and test environments, for example: ubuntu-22.04-developer-build, ubuntu-22.04-developer-build-x11-tests, ubuntu-24.04-arm64-developer-build-wayland-tests, ubuntu-24.04-arm64-developer-build and many many others. | |||
[[File:Config ids in grafana.png|thumb|Grafana panels showing config statistics grouped per results for all functions in tst_QQuickTextArea case.|600x600px]] | |||
Config information is widely used in Grafana dashboards, enabling users to identify the platforms where a test is failing or to view statistics on platform stability. | |||
Configs definition are scattered in code repositories, each module has its own config file ''coin/platform_configs'' (module) e.g.: [https://code.qt.io/cgit/qt/qt5.git/tree/coin/platform_configs/qtbase.yaml qt/qt5/coin/paltform_configs/qtbase.yaml] or [https://code.qt.io/cgit/qt/qt5.git/tree/coin/platform_configs/cmake_platforms.yaml qt/qt5/coin/cmake_platforms.yaml] . | |||
Additional properties describing configs are called configure arguments such as: -no-pch, -verbose, -opengl-no-xcb, and are also stored in db and can be displayed on dashboards. | |||
Coin_features are parameters used to describe workitemes for example: Sccache,DisableTests, TestOnly, Debug and many many others. Features trigger for custom instructions mostly defined in qtbase.git/coin/ instructions. | |||
Notable features | |||
'''Insignificant''' coin_feature relates to both build and test workitems. In case of build or test failure - the state is labeled “Insignificant” not “Failed” and they do not stop integration. | |||
'''InsignificantTests''' coin_feature relates only to test workitems. Tests will be executed and workitem will have status "Insignificant" instead of "Failed", in case of failure. | |||
'''DoNotAbortTestingOnFirstFailure:''' run all tests, instead of stopping/aborting after first failure | |||
'''WarningsAreErrors:''' Workitems builds will fail at warnings. | |||
Workitems also have their own unique identifiers (workitem ids), which are used in Grafana dashboards to construct URLs linking to the corresponding workitem logs. Note that cached workitems can be shared among multiple integrations to optimize performance. | |||
Additionally, task and workitem duration data is available. An example dashboard can be found at: | |||
[https://testresults.qt.io/grafana/d/7d7d6966-13e9-46a1-8ace-74055832c08a/coin-workitems-duration-and-failure-rate CI - Workitems Duration and Failure Rate Dashboard] | |||
Additionally environment variables can also be displayed in Grafana. | |||
Note that while the Qt test results Grafana dashboards are public, the underlying database and dashboard editing permissions are restricted to Qt Company internal use. | |||
'''Workitem properties''' | |||
Both tasks and workitems have additional properties such as '''project''' and '''branch'''. The '''project''' (also referred to as a ''module'') represents the codebase being built and tested within the CI system. Projects are not limited to Qt library modules; they may also refer to other components, such as the Qt Creator project. If a project has dependencies, those dependencies are automatically resolved and built as part of the task.For example, a qt/qtdeclarative task will include build workitems for its dependencies (such as qtbase and qtsvg), but only test workitems for qtdeclarative itself. Branch names depend on the project. In addition to regular Qt project branches, you may encounter temporary branches created by Coin agents or the cherry-pick agent. | |||
Each task is also associated with a '''SHA-1''' hash corresponding to a specific Gerrit change and patchset. This SHA-1 can be used, for example, to identify which Gerrit change introduced a regression and caused a test to start failing..<gallery mode="nolines" widths="400" perrow="2"> | |||
File:Sha-1.png|Table view in Grafana dashboard displaying SHA-1 property of task in which given test has failed | |||
File:Gerrit Sha 1.png|Same patchset SHA-1 visible in Gerrit | |||
</gallery>'''Time zones in data timestamping''' | |||
Note that all data timestamps are by default in the UTC timezone, including internal Coin data, but the presentation layer can be localized. Grafana also uses UTC by default, but it is possible to change the settings to display data in a localized timezone. If you do this, remember that the original data timestamp remains in UTC. Gerrit and Coin web interfaces display localized timestamps. For example, for Oslo/Berlin, the displayed timestamp will be UTC+1 or UTC+2, depending on whether daylight saving time is currently in effect. | |||
[[File:UTC.png|alt=Grafana UTC time settings (top right corner)|thumb|Grafana UTC time settings (top right corner)]] | |||
'''Automatic test results''' | |||
Most of the statistics are concentrated about results of automatic tests runs. Following information can be easily obtained from dashboards: failed, flaky, crashed, blacklisted and skipped tests and to limited scope passed tests. | |||
The test execution provides not only result information but test case name, test function, optional test function argument called data tag if exists, as well as execution duration. Result from any test run can be connected to identify in which it was run task , workitem, and provide shortened log (log.txt) and full CTest.log. | |||
One of the confusing parts can be test case name - the database and Grafana stores and presents both test executable name and test case: | |||
'''test_case''' - name of test case as defined in source file, and present inside test execution result xml file eg: <TestCase name="tst_QMediaPlayerBackend"> | |||
'''test_executable''' - name of test binary defined in makefile, ame of result xml file, also used in logs eg: | |||
agent:2026/01/20 02:40:32 build.go:415: 48/64 Test #48: tst_qmediaplayerbackend ..........***Failed 317.73 sec | |||
<gallery mode="nolines" widths="400"> | |||
File:Test case in drop down menu.png|Test case used in Grafana drop down menu | |||
File:Table panel test case.png|Grafana table view listening test case name and executable | |||
</gallery> | |||
The differences in test result categorization and interpretation are explained in detail [[Further reading]]; the following serves as a brief reminder. Each automatic test function that fails is re-run up to five times. If the function passes at least once during these re-runs, it is classified as '''flaky'''. If it fails in all five consecutive runs, it is classified as '''failed'''. If the test outcome cannot be determined—for example, due to a corrupted output XML—the test is classified as '''crashed'''. Crashed tests are rerun once. Both '''failed''' and '''crashed''' tests within a workitem cause the workitem status to be set to '''Failed'''. Consequently, any integration task containing a failed workitem will also have its status changed to '''Failed'''. | |||
A special category is '''blacklisted tests'''. These tests are executed and produce results marked as '''BPASS''' or '''BFAIL''' instead of PASS or FAIL, but their outcomes are ignored at the Coin level thus blacklisted tests do not cause the workitem or the task to fail. | |||
Note that combinations of outcomes can occur. For example, during re-runs of failed tests, a test may crash. Blacklisted test functions can also crash, and blacklisting mechanism does not fully protect test workitems from causing an integration to stop. | |||
Information about test execution duration is also stored and analyzed, with particular focus on abnormally long-running tests. An example dashboard: | |||
[https://testresults.qt.io/grafana/d/d55b6230-5ceb-4962-acc2-83810e2be68c/things-gone-wrong-in-last-healthcheck Recent Health Checks Analysis Dashboard] | |||
====== '''''Further reading''''' ====== | |||
[https://testresults.qt.io/coin/doc/ Coin - Qt Continuous Integration System documentation] | |||
[https://doc.qt.io/qt-6/cross-compiling-qt.html Qt cross compiling - documentation page] | |||
[https://doc.qt.io/qt-6/qttest-index.html Qt test framework - documentation page] | |||
[[Qt test system|Automatic tests execution - wiki page]] | |||
Latest revision as of 22:07, 10 March 2026
This article explains the glossary related to Coin, the Qt Company Continuous Integration system, from a Grafana user’s perspective. It provides a basic understanding of Coin terminology that is helpful for correctly interpreting metrics, dashboards, and trends. The page presents a simplified view of Coin concepts as they appear in Grafana and intentionally omits internal implementation details. For deeper technical explanations, see the references listed in Further reading.
A task represents a single CI job scheduled either by a user or by agents. Every task has a specific type, such as:

- Integration - task that tries to integrate a change in Gerrit into a Qt submodule
- Early warning - pre-check scheduled from Gerrit
- Status check a job scheduled by a user directly on the Coin web interface
- Nightly and Health checks - special tasks run every night to test the latest versions of all Qt submodules. Health checks build and test the latest qt5.git and all submodules on their last submodule-updated SHA-1s
Task types are labeled in the Coin web interface, they have distinct icons, and the same categorization (for example, Integration vs. Status check) also appears in different tables across Grafana dashboards.

See related dashboard:
Recent Health Checks Analysis Dashboard
For most flaky test statistics, only test results from integrations tasks are typically considered.
Each task has a unique task id, which serves as its identifier. The id can be used to construct a URL that shows the status and results of a Coin task, following the pattern:

https://testresults.qt.io/coin/integration/qt/{module_name}/tasks/{task_id}
for example: https://testresults.qt.io/coin/integration/qt/qt5/tasks/nightly1767303902
Here, qt5 is the module_name and nightly1767303902 is the task_id.
Tasks URLs can be found in panels providing detailed information about test runs (see picture).

Workitems
Each task contains several workitems, organized into three categories:
- Provision - create images building and testing
- Build - build libraries and tests
- Test - execute tests
Workitem States
Each workitem has a state that describes its current status or final outcome. Possible states include:

- Done – completed successfully
- Running – currently in progress
- Cancelled –job was cancelled or failed before the workitem has completed
- Waiting for hardware - waiting for resources either as actual hardware or virtual machine
- Failed – encountered some sort of execution error
- Error – any failure outside of the VM running instructions
- Timeout - given state (Running, or Waiting for hardware) did not finish within time limits
- Insignificant – workitem failed, but the result does not affect the overall task result
Build platforms

Qt is a multi-module, cross-platform library. Qt modules are often—but not always—built on a host platform and then executed and tested on a target platform. In most cases, a platform is defined by a combination of: operating system and version (e.g. macOS 12, Ubuntu 20.04), processor architecture (e.g. x86, x86_64, ARM64) and compiler (e.g. Clang, GCC, MSVC). In Grafana, this information is exposed through fields such as host_os_version, target_os_version, host_arch, target_arch, host_compiler, and target_compiler. Note that that some qt builds run on virtual or embedded platforms, and require emulator eg Android, VxWorks.
Coin tracks platform details in even greater detail using so called configuration ids or configs. These identifiers describe in more detail concrete build and test environments, for example: ubuntu-22.04-developer-build, ubuntu-22.04-developer-build-x11-tests, ubuntu-24.04-arm64-developer-build-wayland-tests, ubuntu-24.04-arm64-developer-build and many many others.

Config information is widely used in Grafana dashboards, enabling users to identify the platforms where a test is failing or to view statistics on platform stability.
Configs definition are scattered in code repositories, each module has its own config file coin/platform_configs (module) e.g.: qt/qt5/coin/paltform_configs/qtbase.yaml or qt/qt5/coin/cmake_platforms.yaml .
Additional properties describing configs are called configure arguments such as: -no-pch, -verbose, -opengl-no-xcb, and are also stored in db and can be displayed on dashboards.
Coin_features are parameters used to describe workitemes for example: Sccache,DisableTests, TestOnly, Debug and many many others. Features trigger for custom instructions mostly defined in qtbase.git/coin/ instructions.
Notable features
Insignificant coin_feature relates to both build and test workitems. In case of build or test failure - the state is labeled “Insignificant” not “Failed” and they do not stop integration.
InsignificantTests coin_feature relates only to test workitems. Tests will be executed and workitem will have status "Insignificant" instead of "Failed", in case of failure.
DoNotAbortTestingOnFirstFailure: run all tests, instead of stopping/aborting after first failure
WarningsAreErrors: Workitems builds will fail at warnings.
Workitems also have their own unique identifiers (workitem ids), which are used in Grafana dashboards to construct URLs linking to the corresponding workitem logs. Note that cached workitems can be shared among multiple integrations to optimize performance.
Additionally, task and workitem duration data is available. An example dashboard can be found at:
CI - Workitems Duration and Failure Rate Dashboard
Additionally environment variables can also be displayed in Grafana.
Note that while the Qt test results Grafana dashboards are public, the underlying database and dashboard editing permissions are restricted to Qt Company internal use.
Workitem properties
Both tasks and workitems have additional properties such as project and branch. The project (also referred to as a module) represents the codebase being built and tested within the CI system. Projects are not limited to Qt library modules; they may also refer to other components, such as the Qt Creator project. If a project has dependencies, those dependencies are automatically resolved and built as part of the task.For example, a qt/qtdeclarative task will include build workitems for its dependencies (such as qtbase and qtsvg), but only test workitems for qtdeclarative itself. Branch names depend on the project. In addition to regular Qt project branches, you may encounter temporary branches created by Coin agents or the cherry-pick agent.
Each task is also associated with a SHA-1 hash corresponding to a specific Gerrit change and patchset. This SHA-1 can be used, for example, to identify which Gerrit change introduced a regression and caused a test to start failing..
-
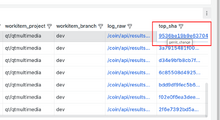 Table view in Grafana dashboard displaying SHA-1 property of task in which given test has failed
 -
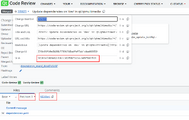 Same patchset SHA-1 visible in Gerrit


Time zones in data timestamping
Note that all data timestamps are by default in the UTC timezone, including internal Coin data, but the presentation layer can be localized. Grafana also uses UTC by default, but it is possible to change the settings to display data in a localized timezone. If you do this, remember that the original data timestamp remains in UTC. Gerrit and Coin web interfaces display localized timestamps. For example, for Oslo/Berlin, the displayed timestamp will be UTC+1 or UTC+2, depending on whether daylight saving time is currently in effect.

Automatic test results
Most of the statistics are concentrated about results of automatic tests runs. Following information can be easily obtained from dashboards: failed, flaky, crashed, blacklisted and skipped tests and to limited scope passed tests.
The test execution provides not only result information but test case name, test function, optional test function argument called data tag if exists, as well as execution duration. Result from any test run can be connected to identify in which it was run task , workitem, and provide shortened log (log.txt) and full CTest.log.
One of the confusing parts can be test case name - the database and Grafana stores and presents both test executable name and test case:
test_case - name of test case as defined in source file, and present inside test execution result xml file eg: <TestCase name="tst_QMediaPlayerBackend">
test_executable - name of test binary defined in makefile, ame of result xml file, also used in logs eg:
agent:2026/01/20 02:40:32 build.go:415: 48/64 Test #48: tst_qmediaplayerbackend ..........***Failed 317.73 sec
-
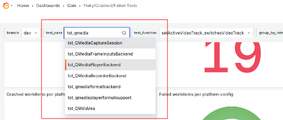 Test case used in Grafana drop down menu
 -
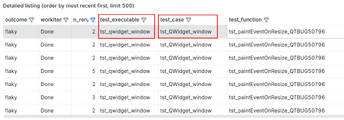 Grafana table view listening test case name and executable


The differences in test result categorization and interpretation are explained in detail Further reading; the following serves as a brief reminder. Each automatic test function that fails is re-run up to five times. If the function passes at least once during these re-runs, it is classified as flaky. If it fails in all five consecutive runs, it is classified as failed. If the test outcome cannot be determined—for example, due to a corrupted output XML—the test is classified as crashed. Crashed tests are rerun once. Both failed and crashed tests within a workitem cause the workitem status to be set to Failed. Consequently, any integration task containing a failed workitem will also have its status changed to Failed.
A special category is blacklisted tests. These tests are executed and produce results marked as BPASS or BFAIL instead of PASS or FAIL, but their outcomes are ignored at the Coin level thus blacklisted tests do not cause the workitem or the task to fail.
Note that combinations of outcomes can occur. For example, during re-runs of failed tests, a test may crash. Blacklisted test functions can also crash, and blacklisting mechanism does not fully protect test workitems from causing an integration to stop.
Information about test execution duration is also stored and analyzed, with particular focus on abnormally long-running tests. An example dashboard:
Recent Health Checks Analysis Dashboard
Further reading
Coin - Qt Continuous Integration System documentation
Qt cross compiling - documentation page