QtWebEngine/Debugging With Visual Studio
Qt Creator offers multiple ways to debug Qt applications on Windows, see Setting Up Debugger. However, some of them may not work properly when debugging QtWebEngine:
- GDB can’t be used on Windows because MinGW build is not supported.
- LLDB might work but it requires a build performed with clang-cl compiler. It is not officially supported at the moment and needs workarounds.
- CDB is the Microsoft’s Console Debugger which is supported and usually works but it reportedly doesn’t always load symbols properly and may result in useless backtraces.
This guide presents an alternative way using Visual Studio IDE for debugging QtWebEngine based applications.
Requirements
This guide requires installing Microsoft Visual Studio. Visual Studio is also essential to build QtWebEngine from source, so there is a good chance you already have it installed. It is recommended to use the 2022 version. At the time of writing this guide (Qt 6.7 is about to release), the 2019 version is also supported. Community Edition should work. For installing the required components, follow the corresponding Chromium Build Instructions. Make sure you also install Windows 11 SDK and SDK Debugging Tools.
Installing Qt and Qt Creator is not essential but recommended for this guide, for the install steps, see Get and Install Qt. It is also recommended to install CMake and Ninja build tools from the installer. The Microsoft Visual Studio versions of these tools are not always working flawlessly when building Qt. This guide also uses the sources downloaded through the Qt installer. Downloading the sources with git should also work just fine. For guide to using git, see Building_Qt_6_from_Git#Getting_the_source_code.
For debugging, you will also need debug Qt libraries. The build process is described briefly in the next chapter.
For the console commands, use the cmd shell. Using PowerShell or any other non-cmd shell is not supported.
Build
For debugging, we need QtWebEngine libraries built with debug information. Theoretically, it is possible to use release binaries with symbol names, in practice, with release configuration the debugger shows wrong information (eg. backtrace) so always make sure you debug libraries built with -debug or -force-debug-info configure options.
Preparations
Make sure you have installed Microsoft Visual Studio with the required components and check Platform Notes for further dependencies (eg. Python3, Node.js, etc.).
You should also install gnuwin32 binaries for Bison, Flex and Gperf. Note that the Qt installer’s MinGW component doesn’t contain these tools, you have to download them from download.qt.io. After extracting the archive, add the location of the binaries to the PATH environment variable:
set PATH=C:\tools\gnuwin32\bin;%PATH%You also need to download Qt sources for the build. For this guide, I used Qt installer and installed the latest Qt release (Qt 6.6.1) with sources.
For development and debugging I prefer shadow build. Shadow build means that the build will happen in a newly created empty directory and the build files will not be mixed with the source files during the build process. The advantage of this setup is that you can create different build configurations with the same source. I also prefer to have separate build directories for Qt modules and QtWebEngine. The advantage of this is that you don’t need to rebuild the whole Qt if you change something in the QtWebEngine build configuration.
The paths for the guide are:
- Qt source directory
C:\Qt\6.6.1\Src - Qt build directory:
C:\Qt\build\qt6-661-debug - QtWebEngine build directory:
C:\Qt\build\qtwebengine-661-debug
The build of Qt and QtWebEngine are described with more details on other wiki pages like Qt for Windows - Building from Source and QtWebEngine/Qt6Build. Make sure to check them, this guide only contains the must have steps for a Windows debug build and some comments for configuration.
Build Qt
Create the directory structure for the build:
cd C:\Qt\
mkdir build
cd build
mkdir qt6-661-debug
cd qt6-661-debug
Configure the command line for MSVC 64 bit build:
"C:\Program Files\Microsoft Visual Studio\2022\Community\VC\Auxiliary\Build\vcvarsall.bat" x64
Configure Qt for top-level debug build:
C:\Qt\6.6.1\Src\configure.bat -developer-build -debug -no-warnings-are-errors -submodules qtbase,qtshadertools,qtdeclarative -nomake tests -nomake examples
Note: -developer-build option is handy for development because binaries are not needed to be installed, they will be available from the build directory.
Note: If the -debug option is not specified, Qt is configured for debug-and-release build. This configuration would contain the release binaries (not needed) and the build takes more time.
Note: Alternatively, you can configure with -release -force-debug-info instead of -debug.
Start the build:
cmake --build . --parallel
Build QtWebEngine
Create the directory structure for the build:
cd C:\Qt\build
mkdir qtwebengine-661-debug
cd qtwebengine-661-debug
Configure QtWebEngine module:
C:\Qt\build\qt6-661-debug\qtbase\bin\qt-configure-module.bat C:\Qt\6.6.1\Src\qtwebengine -- -DQT_BUILD_EXAMPLES=ON -DFEATURE_qtpdf_build=OFFNote: V8 and Blink debug symbols are disabled even for debug build because they significantly increase build time, binary sizes and MSVC might not be able to link them. We usually do not need to debug these components but if you still would like to give it a try, configure QtWebEngine with -DFEATURE_webengine_full_debug_info=ON option.
Note: The build of the Chromium part of QtWebEngine is performed with a recursive ninja call. This means that options (like the one for parallel build) will not be passed for building Chromium sources. QtWebEngine build system provides NINJAFLAGS environment variable to pass ninja options for the build. The environment variable should be set before the configure command. For example, set NINJAFLAGS="-j8".
Start the build:
cmake --build .
Note: The --parallel CMake option is not used for QtWebEngine build. It will not have any observable effect because of the recursive ninja call. Use NINJAFLAGS environment variable instead.
Debugging
Simplebrowser Example
We need a QtWebEngine based application for debugging. The simplebrowser example is a good choice for testing because its implementation is relatively simple and supports basic browser functionalities.
For running a Qt based application, the Qt libraries have to be available otherwise the application will report errors like "Qt6WebEngineCored.dll is not found". The required libraries can be copied into the application’s directory or the location of the libraries can be added to the PATH environment variable:
set PATH=C:\Qt\build\qt6-661-debug\qtbase\bin;%PATH%
The qmake tool can be used to check if the Qt libraries are available:
qmake -v
The expected output is:
QMake version 3.1
Using Qt version 6.6.1 in C:/Qt/build/qt6-661-debug/qtbase/lib
Change to the directory of the example:
cd c:\Qt\build\qtwebengine-661-debug\examples\webenginewidgets\simplebrowser
Start the application:
simplebrowser.exe
The example should run without any error but there is no output on the console. Simplebrowser is built as a GUI application and that is why it does not use the console. For testing, it can be useful to get console messages about errors or warnings. Visual Studio debugger and Qt Creator can capture the console messages without any change but it is also possible to change an application's project file and make it a console application.
The project file of simplebrowser is at C:\Qt\6.6.1\Src\qtwebengine\examples\webenginewidgets\simplebrowser\CMakeLists.txt. Open the file with an editor and change WIN32_EXECUTABLE to FALSE:
--- a/examples/webenginewidgets/simplebrowser/CMakeLists.txt
+++ b/examples/webenginewidgets/simplebrowser/CMakeLists.txt
@@ -38,7 +38,7 @@ if(WIN32)
 endif()

 set_target_properties(simplebrowser PROPERTIES
-    WIN32_EXECUTABLE TRUE
+    WIN32_EXECUTABLE FALSE
     MACOSX_BUNDLE TRUE
     MACOSX_BUNDLE_GUI_IDENTIFIER "io.qt.examples.webenginewidgets.simplebrowser"
 )
Note: See CMake documentation for the details about the WIN32_EXECUTABLE property.
Change to the directory of the example:
cd c:\Qt\build\qtwebengine-661-debug\examples\webenginewidgets\simplebrowser
Rebuild the example only:
cmake --build .
Start the application:
simplebrowser.exe
You are expected to see the WebEngineContext information dumped to the console. This is a debug log specific to QtWebEngine. Chromium also has its own debug logging which can be enabled via command line arguments. Any Chromium specific command line argument should be passed to the application after --webEngineArgs command line option. This separates the user's application specific options from the WebEngine's ones.
Enable Chromium logging to standard error:
simplebrowser.exe --webEngineArgs --enable-logging=stderr --v=1
Visual Studio
The Visual Studio IDE can be started from the command line by the Devenv command. You can tell the IDE to open a certain executable for debugging with the /DebugExe switch.
Make sure you initialize MSVC 64 bit environment before calling Devenv:
"C:\Program Files\Microsoft Visual Studio\2022\Community\VC\Auxiliary\Build\vcvarsall.bat" x64
Start Visual Studio IDE:
devenv /DebugExe simplebrowser.exe

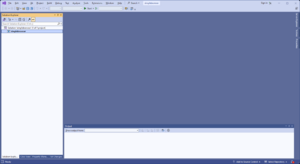
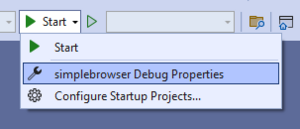
The application is not running yet thus you have the possibility to configure the way how the application is started for debugging:

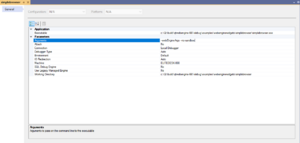
For example, you can specify command line arguments:

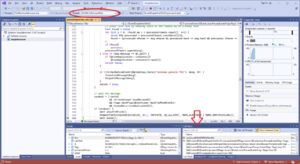
The application can be started with the Start button on the menu bar. For demonstration purposes, I’ve stopped the running application by the Break All (pause icon) button. Note the thread selector drop down list on the menu bar. The browser’s main thread is the CrBrowserMain. The backtrace is visible at the bottom right corner of the window by default.

Renderer Process
Chromium manages multiple processes and QtWebEngine has the same process architecture. The main process is called Browser process which is the running instance of the browser application (eg. simplebrowser.exe). Only one browser process runs, it represents the top-level browser window, manages and starts other processes. For communication between processes, Chromium uses its own messaging API called Mojo. The Chromium multi-process architecture consists various type of processes, eg. Utility processes, GPU process, Renderer processes, etc. but not all of them are supported by QtWebEngine.
For us, the most important sub-process type is the Renderer process. Multiple Renderer processes are running at the same time and they are responsible for handling web content. Blink (Rendering Engine) and V8 (JavaScript Engine) are part of the Renderer process. Roughly, the architecture looks as if each browser tab would have its own Renderer process. In practice, this is much more complicated and also configurable. Read Chromium documentation for the details: Multi-process Architecture and Process Model and Site Isolation
For QtWebEngine, the Renderer process binary is called QtWebEngineProcess.exe and it is located in the qtbase\bin directory. The location of the executable can be customized but the Browser process has to find it thus QtWebEngine uses QTWEBENGINEPROCESS_PATH environment variable to make it easier, see Deploying Qt WebEngine Processes for more details.
Keep in mind that the Renderer process is sandboxed and it is advisable to disable it for debugging via the --no-sandbox command line argument. Moreover, only the Browser process is supposed to start the process so the previously described way of debugging will not work. Luckily, Chromium provides various ways to attach debugger to an already running Renderer process and most of these also work with QtWebEngine. For details, read Chromium's guide to debugging on Windows.
This guide shows the usage of the --renderer-startup-dialog command line argument which will stop the sub process at startup and gives you enough time to attach the debugger:
Start simplebrowser and stop Renderer process at startup:
simplebrowser.exe --webEngineArgs --renderer-startup-dialog --no-sandbox
A popup dialog shows the Renderer process id to attach to. Pressing the OK button continues the running of the process. It should be clicked only after attaching to the process, keep the popup alive for now.
TODO: screenshot
Open another terminal and setup the debug environment for QtWebEngineProcess.exe:
"C:\Program Files\Microsoft Visual Studio\2022\Community\VC\Auxiliary\Build\vcvarsall.bat" x64
set PATH=C:\Qt\build\qt6-661-debug\qtbase\bin;%PATH%
Change directory to the location of the process executable:
cd C:\Qt\build\qt6-661-debug\qtbase\bin
Start the debugger:
devenv /DebugExe QtWebEngineProcess.exe
Now you have to attach to the process:
TODO: screenshot
Use the search field to find the process based on the given process id:
TODO: screenshot
Attach to the process, press OK on the popup dialog and start debugging:
TODO: screenshot
Single Process Mode
For debugging the Renderer process, the most convenient way would be to execute the renderer code in the Browser process. Actually, Chromium kind of supports this and it is called Single Process Mode. Unfortunately, this mode has several disadvantages which makes this option difficult to use:
- The code path alters this case because the renderer code runs in a dedicated thread and that is another implementation. Due to this, the issue is often not reproducible.
- Single process mode often crashes or asserts. This mode is only for debugging and testing purposes, Chromium’s CI does not even test it. New features or bug fixes are usually adapted to single process mode much later.
- Some features are just not available for single process mode. For example, multiple profiles and sandbox.
- Chromium developers would like to get rid of it and they may not accept related fixes.
Single process mode can be enabled with the --single-process command line argument. Simplebrowser does not support it because of the multiple profile restriction. It is possible to workaround this in the source code but it is easier to use an even more simple example: the minimal browser.
The minimal browsers are available as manual tests since Qt 6.5. They are not built by default. These are the steps to build minimal-widgets example manually:
Create empty directory for shadow build:
cd C:\Qt\build\qtwebengine-661-debug
mkdir minimal-widgets
cd minimal-widgets
Configure example:
C:\qt\build\qt6-661-debug\qtbase\bin\qt-cmake-standalone-test.bat C:\qt\6.6.1\Src\qtwebengine\tests\manual\examples\widgets\minimal
Build:
cmake --build .
Start example in single process mode:
cd build_dir
minimal-widgets.exe --webEngineArgs --single-process --no-sandbox